A modified version of the EPA 1694 Method: Pharmaceuticals and Personal Care Products in Water, Soil, Sediment, and Biosolids by HPLC/MS/MS
Pharmaceutical Standards
Primary Standards (raw chemical)
- Nicotine obtained from: Cambridge Isotope Laboratories, Inc.; PN# N-008; $18 for 1mg/mL in MeOH; CAS#54-11-5
- Cotinine obtained from: Cambridge Isotope Laboratories, Inc.; PN# C-016; $25 for 1mg/mL in MeOH; CAS#486-56-6
- Acetaminophen obtained from: Sigma-Aldrich; 4-Acetamidophenol PN# A7302-5G-A; $16 for 5 grams; CAS# 103-90-2
- Sulfamethoxazole obtained from: Bioworld; PN# 41910016-1 (762346-6); $41.90 for 25 grams; CAS#723-46-6
- Carbamazepine obtained from: Sigma-Aldrich; PN# C4024-1G; $21 for 1 gram; CAS# 298-46-4
- Fluoxetine hydrochloride USP obtained from: Spectrum Chemical Mfg. Corp.; PN# F1200; $152.90 for 5 grams; CAS# 59333-67-4
- Progesterone obtained from: Sigma-Aldrich; PN# 850454-5G; $20 for 5 grams; CAS# 57-83-0
- Atrazine-D5 (internal standard) obtained from: Fluka/Sigma-Aldrich; PN# 34053; $229 for 10 mg; CAS# 163165-65-1
Secondary Standards (Single chemical solution)
- Makeup individual solutions for each compound in HPLC grade methanol at 500,000 ng/mL, with the exception of the Atrazine-D5 internal standard make up at 50,000 ng/mL in MeOH
Intermediate Standard/Spiking solution (Combined chemical solution)
- Makeup combined solution with all seven compounds in HPLC grade methanol at 2500 ng/mL and 5000ng/mL(acetaminophen only)
- Makeup internal standard solution with Atrazine-D5 at 50 or 250 ng/mL
Working Standards (Quality control standards)
- Makeup HPLC/MS calibration standards in 0.1% Formic Acid at approximately: 10, 25, 50, 100, 250, 500, and 1000 ng/mL
Microcosms Setup
 Figure 1: Test jars rinsed and labeled, filled with tap water and spiked with nutrient solution and pharmaceuticals, ready for plants to be added to specific jars
- Rinse sample jars (wide-mouth pint-size Mason jars) with HCl, MeOH, and then tap water
- Label sample jars(triplicate jars with treatments: A = dark no plant; B = dark with plant; C = light w/ plant; D = light no plant; E = light w/ macerated plant; X=control w/ lids)
- Record tare weight of jars
- Fill jars with approximately 400 mL tap water (fill jars for macerated duckweed with only 200 mL tap water)
- Spike jars with Farrell.v2 nutrient soln. (1:400 "A" and 1:1000 "B,C,D" stock solutions)
- Spike jars with 500ng-pharmaceuticals, except for 1000ng-acetaminophen
- Wait 1 hr. to chemicals to equilibrate in solution
- Weigh jars with solution
- Cover jars with paper shields that are white on outside and black on the inside
Add fresh duckweed to jars

Figure 2: Fresh duckweed added to jar spike with nutrient solution and 7-pharmaceutical compounds in tap water
- Acclimatize duckweed in container with 10+ liters of Farrell.v2 nutrient soln. (1:400 "A" and 1:1000 "B,C,D") for 24 hours
- Spoon approximately 300g-fresh duckweed and strain excess water with butterfly-netting
- Place squeezed duckweed into tared aluminum dish, adjust weight to approximately 300g-fresh, and record fresh weight.
- Dump duckweed into appropriate jar with nutrient soln. and pharmaceutical compounds.
- Set aside an aliqout of fresh material prepared the same way to obtain the dry weight (60 degC).
Add macerated duckweed to jars
 Figure 3: Macerated duckweed being added to test jars after 2 minutes in blender and continuously mixed in 1000 mL beaker to maintain homogenous mixture
- Prepare fresh duckweed according to instruction above for enough jars that will require macerated duckweed (i.e. triplicate jars x 3 time periods x 300 g-fresh/jar = 2700 g-fresh duckweed)
- Dump duckweed into a blender with no more than one-third the required tap water (i.e. 9 jars required * 400mL/jar * 0.33 = 1200 mL)
- Macerate fresh duckweed in the blender at low speed (to reduce foaming) for approximately 2 minutes
- Decant liquid into a glass beaker, rinsde blender to recover all the solids.
- Mix contents of beaker with glass stir-rod to obtain a uniform suspension of solids.
- While mixing, pour the proper amount of solution into a graduated cylinder and then to the proper test jar for macerated duckweed (e.g. 2700g-fresh/1200mL per 9 jars = 300g-fresh/133mL per jar)
- Rinse walls of the graduated cylinder with tap water in order to recover all solids and then bring the volume up to approximately 400 mL like the other test jars.
 Figure 4: Jars ready for experiment in triplicate for treatments (L to R) A-dark no plants, B-dark w/ plants, C-light w/ plants, D-light no plants, and E-light w/ macerated plants
Begin Microcosm Experiment
- Place all light-treatment jars 40" below 1000 W HPSLs (200 umol/m^2-sec)
- Place all dark-treatment jars underneath a cardboard box close to the light jars in order to maintain at similar temperatures.
- Record the testing start time.
- Stop tests and separate liquids/solids at time = approximately 2 hours, 24 hours, and 4 days
 Figure 6: Microcosm experiment started with treatment jars spread randomly 40 inches beneath a 1000 W High Pressure Sodium Lamp
Separate liquids/solids* for jars containing duckweed
Video 1: Separating duckweed solids from the liquid
- Record stop time and jar weight
- Cover open top of jar loosely with butterfly netting (leave a little pouch of netting above the jar), hold in place with rubber band around the mouth of the jar
- Invert jar into a 1000 mL beaker
- Squeeze excess liquid from duckweed solids without removing the butterfly netting from the jar
- Rinse the inside of the jar and butterfly netting with tap water (waste this liquid) for approximately 10 seconds to rinse solids sticking to the jar and capture as much solids as possible in the bottom of the netting.
- Remove the netting from the jar (don't squeeze yet), pour the liquid captured in the 1000 mL beaker back into the testing jar
- Rinse the 1000 mL beaker and hand to dry for the next harvest
- Twist the netting and squeeze the excess liquid from the duckweed back into the testing jar for a count of seven.
- Tare an aluminum weighing dish
- Put the clump of freshly harvested duckweed solids onto the tared dish, scrape excess solids from the netting
- Record fresh weight of duckweed and set in 60 degC oven (dry for 10 hours until a stable dry weight is obtained, try not to exceed 24 hours). Once dry, solids are ready for extraction preparation steps**
- Record the weight of the test jar plus liquid, place a lid on the jar which is now ready for the cleanup step (perform cleanup step within 6 hours of harvesting)
**Note: thermal degradation at 60 degC should not be an issue. Thermal degradation (TD) charts for each compound show that it does not create significant removal below 100 degC. On the other hand, the table below shows that the percent of compound recovered after evaporating the compound to dryness at 60 degC and then re-constituting to 1 mL and analyzing by HPLC/MS gives lower than expected recoveries for several of the compounds. The reason for the loss is probably more a function of evaporating to dryness than it is thermal degradation since none of the compounds should lose more than 10% mass at 60 degC (see quantities below). During the concentration step, the EPA 1694 method only recommends evaporating to 1 mL and then bringing the volume up to 4 mL. If the sample is concentrated below 0.5 mL then it extraction efficiencies decrease.
Table: Extraction Efficiency post 60 degC Evaporation to Dryness
 Expected temperature when thermal degradation becomes an issue:
Sulfamethoxazole (above100 degC)
Carbamazepine (above 170 degC before transformation and less than 10% loss under 70 degC)
Acetaminophen (above150 degC)
Fluoxetine (99% @ 185degC and 95% @ 211 degC)
Progesterone (above130-200)
An explanation about "Thermogravimetric analysis"
Carbamazepine (above 170 degC before transformation and less than 10% loss under 70 degC)
Acetaminophen (above150 degC)
Fluoxetine (99% @ 185degC and 95% @ 211 degC)
Progesterone (above130-200)
An explanation about "Thermogravimetric analysis"
Table: Liquid Extraction Efficiency

Table: Compound Percent Recovery and Loss due to not rinsing/silinizing glassware during Liquid Solid Phase Extraction procedure

 Figure 7: Jar with duckweed plants at conclusion of test. Roots lengthen as nutrients deplete and necrotic duckweed tissue settles to the bottom of the jar.

 Figure 7: Jar with duckweed plants at conclusion of test. Roots lengthen as nutrients deplete and necrotic duckweed tissue settles to the bottom of the jar.
 Figure 8: Fresh duckweed recently separated from the solids and ready to dry for 10-24 hours in a 60 degC oven until a stable dry weight is obtained.
Liquid cleanup (Modified from the EPA 1694 Test Method):
 Figure 9: Liquid cleanup retaining organics from the liquid phase onto Waters Oasis HLB 6cc SPE cartridges
- Note: If solids are visible in the liquid then it is highly recommended to filter the samples before passing contents through the Waters Oasis HLB 6cc Solid Phase Extraction cartridge which will speed up extraction times and allow for more liquid to pass through the cartridge
- Note: When pre-filtering liquids, glass-fiber filters (AP40 and GF/A 1.6 pore size used for these tests) are recommended; however, perform tests to determine the pharmaceutical retention by the filters.
Filter liquid
- Rinse 500mL Erlenmeyer flask/filter apparatus with methanol and tap water
- Place AP40 or GF/A filter pad on the filter apparatus
- Slowly pass liquid sample through the filter(s) and the rinse gently with deionized water
- Put all used filter pads for each sample into a 15 mL centrifuge tube
- Pour Erlenmeyer flask contents back into the test jar, rinse with deionized water, and record liquid weight (to be used in case not all contents pass through the Oasis HLB cartridge)
- Clean filter apparatus and flask with methanol and then decant into the 15 mL centrifuge tube containing the used filter(s), and bring to the 15 mL mark with methanol.
- Liquid now ready for cleanup. Vortex (5 min) and sonicate (30 min) in an ultrasonic bath before evaporating and HPLC/MS anaslysis.
Load Cartridge
- Clean vacuum tubes by rinsing with methanol, blowing air through the tubing, and rinsing again with deionized water
- Precondition Oasis HLB 6cc (Waters PN# 106202) solid phase extraction cartridges: **Note: due to the nature of the pharmaceuticals selected for this study, all liquid samples were extracted under neutral conditions (i.e. no pH change) in order to obtain the highest recoveries for all seven compounds
- Rinse cartridges with at least 3 cartridge volumes of methanol (approximately 6 mL per cartridge), do not let it go dry
- Rinse cartridges with at least 2x the methanol rinse volume (approximately 30 mL), do not let it go dry
- Attach vacuum tubes to cartridges and sample bottles
- Load cartridge with sample(s) at a rate of 5-10 mL/min (approximately 7 mmHg)--watching constantly to prevent cartridge from going dry
- Dry cartridge under vacuum for approximately 5 minutes
- Elute cartridge with 10 mL of methanol at a slow rate (approximately 3 mmHg), capture in borosilicate vial
- Re-condition cartridges with 20-30 mL methanol and save for future use
Concentration
1. Clean receiver flask by soaking in soapy water for at least 3 hours, rinsing with deionized water, followed by rinsing with methanol. To improve recoveries by approximately 10% then silanize the receiver flask.1a. Silanize receiver flask (Baker, 2011) by pouring dichloromethyltoluene (DCMT) solution into the receiver flask and then decanting back into the DCMT bottle
1b. Rinse receiver flask with methanol, fill with methanol, and let stand for at least 1 hour
2. Pour 10 mL eluted volume into the receiver flask and dry to 0.25 mL (minimal precipitation) or 1mL (visible precipitation/floc) under a gentle stream of nitrogen gas (10-15 psi) at 55 degC (TurboVap)
2a. While drying, thoroughly rinse the receiver flask sidewalls (increases percent recoveries by more than 50% for several compounds) as the solution evaporates. Rinse with the solution in the flask, adding more methanol is not typically necessary.
2b. As solids precipitate to the glassware, rinse and sonicate the receiver flask.
2c. When the solution reaches approximately 2-5 mL then rinse the receiver flask using a disposable pasteur pipette
 Figure 10: Solids precipitating from solution during the evaporation step. Continuous rinsing and ultrasonication is recommended to prevent buildup of solids on the receiver flask.
3. Bring volume up to 1 mL (minimal precipitaiton) or 4 mL (visible precipitation/floc) with 0.1% formic acid
3a. If the dilluted solution still appears cloudy then it will be necessary to centrifuge the solution.
3b. Pipette dilluted solution into a polypropylene microcentrifuge tube
3c. Centrifuge for 3 min at 10,000-11,000 rpm
4. Pipette sample into 2 mL HPLC glass vials with teflon septum. Add spikes and/or internal standards, if necessary. Samples are now ready for HPLC/MS analysis.
 Figure 11: Agilent HPLC/MS
 Figure 12: 2 mL HPLC autosampler vial representing several hours of work including filtration/separation, cleanup, concentration, and centrifugation.
HPLC/MS Instrument Configuration
- Devices: Agilent 1200 Series High Performance Autosampler SL (PN# G1367C); Agilent 1260 Series Binary Pump (PN# G1312B); Agilent 1200 Series Thermostatted Column compartment SL (PN# G1316B); Agilent G6220A Time of Flight Detector (PN# G6220A)
- TOF/Q-TOF Mass Spectrometer: Ion Source: Dual ESI, Ion Polarity: Positive Mode; Gas Temp. 350 degC; Gas flow 12 L/min; Nebulizer 25 psi; Scan Vcap = 3500 V; Reference masses 121.050873 to 922.009798; Chromatagram TIC type; 9.2 min stop time; 10 min run time w/ 3 min runtime between runs
- Binary Pump: Flow 0.35 mL/min; Pmax = 500 bar; Solvent "A" 0.1% Formic Acid and 0.1% MeOH; Solvent "B" 90/10 Acetonitrile/H2O + 0.1% Formic Acid; Pump Time Table: 0 min. @ 3% "B", 1 min. @ 3% "B", 5 min. @ 100% "B", 8 min. @ 100% "B", and 10 min. @ 3% "B"
- Column: Agilent Eclipse Plus C18 (2.1 x 55 mm, 1.8 um) PN# 959741-902; Column-SL temperature 30 degC
- Autosampler: Injection Volume 5 uL w/ 3 sec. needle wash; Draw position 3 mm; Draw/Eject speed 200 uL/min; Equilibration time 0-2 sec. ***Custom Injection Program for Internal Standard Runs: 1st Eject, 2nd Draw 5 uL Atrazine-d5 (instd), 3rd Needle wash 3 sec., 4th Draw 5 uL sample, 5th Needle wash 3 sec, 6th Wait 2 sec., 7th Inject 10 uL
Solids Extraction
(still in the process of developing this method since recoveries are very poor)
(still in the process of developing this method since recoveries are very poor)
Video 2: Demonstrating the process of preparing dried duckweed for extraction (demonstrating steps 1-4 below)
 Figure 13: Crushed duckweed following 60 degC drying
- Place 60 degC dried duckweed into mortar/pestle
- Crush duckweed
- Pour crushed duckweed into weighing dish, record mass, and then pour into 15 mL centrifuge tube
- Rinse aluminum weighing dish (used for drying) and mortar/pestle with methanol. Save methanol and add to the 15 mL centrifuge tube. Repeat rinsing until centrifuge tube is full.
- Allow solids to sit in methanol for >24 hours
- Vortex sample 5 min
- Ultrasonic bath for 30 min
- Centrifuge 5000 rpm for 5 min
- Decant solution into receiver flask
- Add 10 mL methanol + 3 mL deionized water
- Repeat vortex/ultrasonic bath/centrifuge/decant steps
- Add 10 mL methanol and repeats vortex/ultrasonic steps
- Pour all contents through a filter into the receiver flask
- Rinse solids/filter with methanol
- Evaporate solution to 5-10 mL under a gentle stream of nitrogen gas (10-15 psi) and 55 degC water bath (TurboVap) *15a. Constantly rinse and ultrasonicate the glassware as the volume decreases and more solids precipiate from solution
- Bring the volume to 200-500 mL with deionized water, the solution is now ready for the cleanup/elution/concentration steps
 Figure 14: Extracted solids following three repetitions of vortexing, sonicating, and centrifuging solids in a mixture of methanol and water. The chlorophyll comes out of the plants and turns the solution very green. Solids begin to precipitate out of solution below 10 mL.
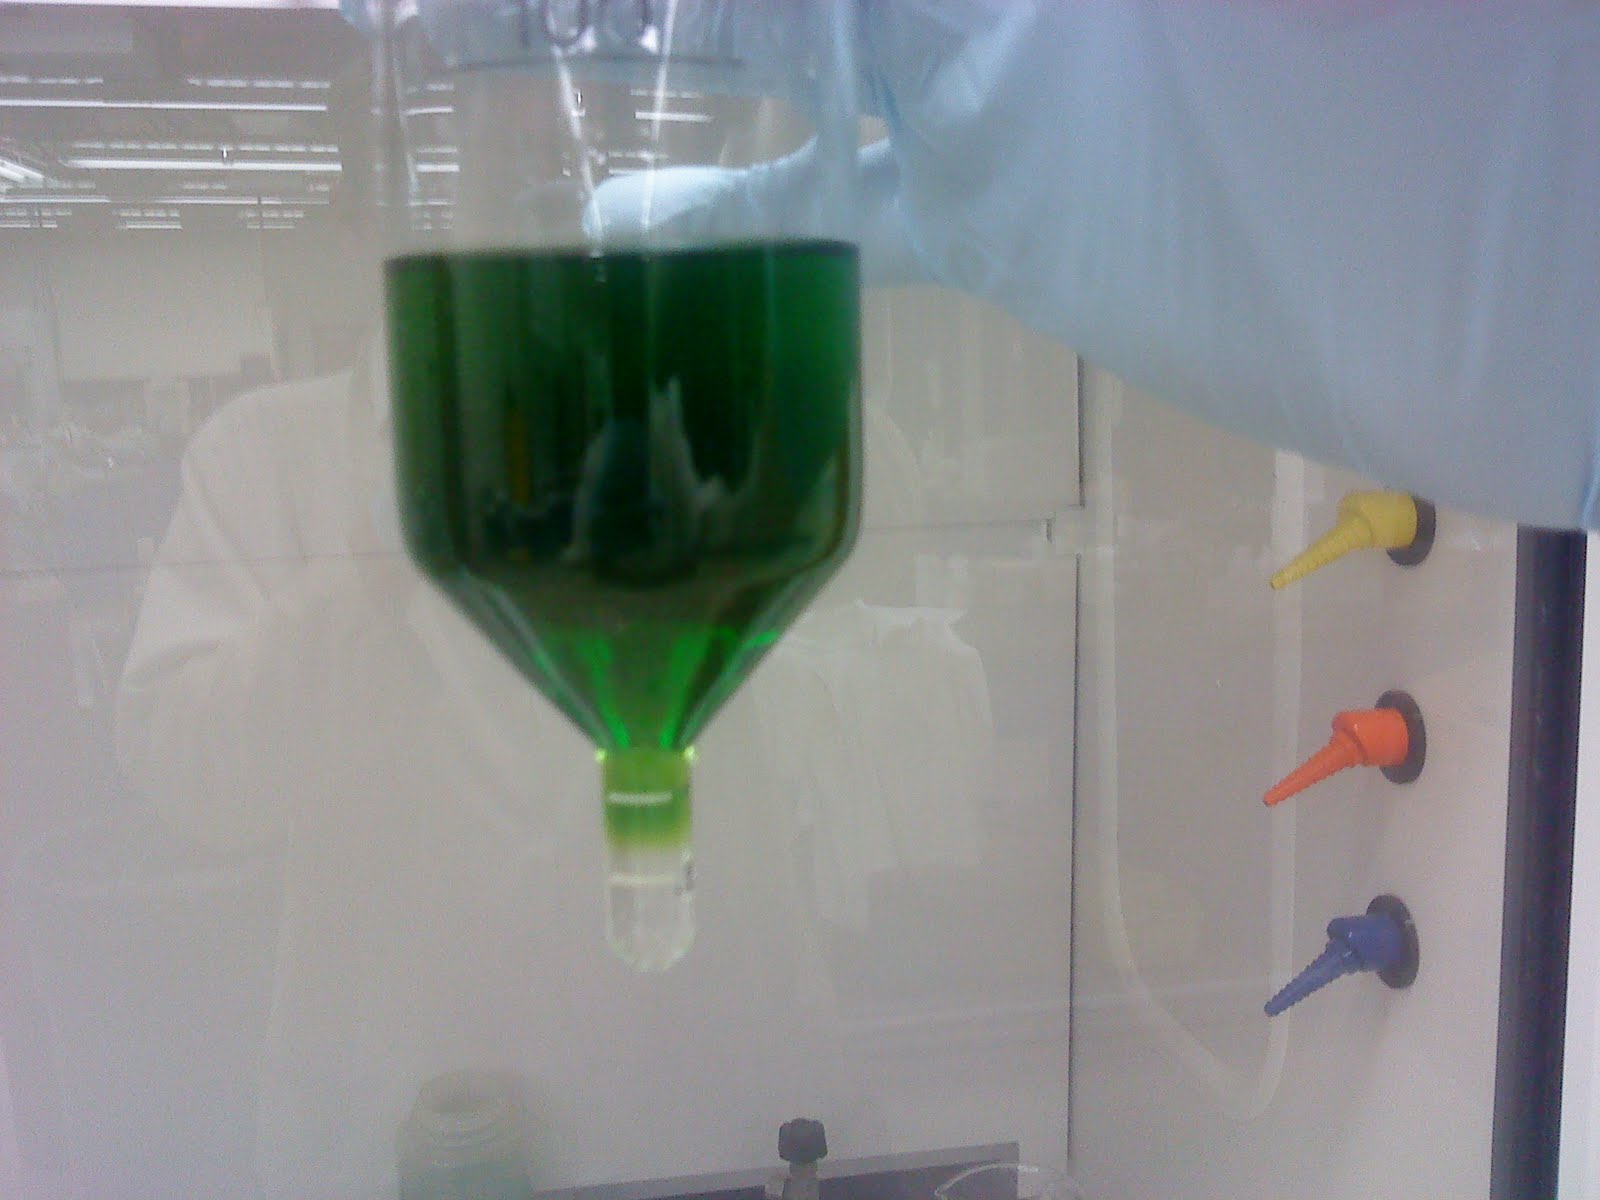 Figure 15: Solids have been extracted in MeOH, concentrated, and now being re-dilluted to 200-500 mL
 Figure 16: Solids have been extracted, concentrated, re-dilluted and are ready for SPE cleanup
 Figure 17: My lab assistants and the future generation of duckweed-experts. Plus, the reason all my waking (and non-waking) hours are not spent in the lab figuring out pharmaceutical extractions from solids.
 Figure 18: Four 2 mL HPLC autosampler vials ready for HPLC/MS analysis representing at least 8 hours of work to obtain 200 uL to 1 mL of sample.
 Figure 19: Sonication by a probe immersed direction in the solid/solvent solution
 Figure 20: Sonication by an ultrasonic bath
Table: Solids Extraction Efficiencies using EPA 1694 Method

*** Added ***
Extracting Pharmaceuticals from Solids:
1. Follow steps outlined previously to dry/crush solids. Store crushed solids (approx. 500 mg-dry) in a 15 mL centrifuge tube with 12mL-methanol plus 2 mL-deionized water.
2. After storage in MeOH for 24 hours, vortex for 5 min, centrifuge, and then:
a) if the expected ng/mL concentration is more than 100 ng/mL, run 1 mL sample on HPLC/MS (approximately 1:14 dilution).
Note: even though the instrument can detect concentrations around 5 ng/mL +/- 10%, the matrix effects produce readings that are 5-10x's less than equivalent concentrations samples without matrix interferences.
b) if the expected concentration is less than 100 ng/mL, decant supernatant from 15 mL centrifuge tube into 15 mL disposable glass culture tube. Place in 60 degC oven and evaporate to 4 mL. Add 1 mL-methanol, vortex in order to clean the sidewalls of the vials, and then micro-centrifuge sample. Analyze 1 mL sample on HPLC/MS (approximately 1:5 dilution).
Note: Formic acid causes solids to precipitate from solution therefore was not added to the solids extracted samples.

Figure 21: Disposable culture tubes after evaporating sample to 4 mL in 60 degC oven. Afterwards 1 mL MeOH added to each vial and samples were centrifuged to clean the sidewalls of the vials. Finally, samples were micro-centrifuged and 1 mL was analyzed by HPLC/MS.
HPLC/MS Analysis using matrix standards:
Note: Previous attempts to extract the solids using the TurboVap received poor extraction efficiencies due to matrix effects and solids precipitating from solution as the evaporation volume decreased. Running samples in Methanol without severe evaporation steps provided as good or better results.
1. Add 500 mg (dry) duckweed--that has not been exposed to pharmaceuticals--to a 15 mL centrifuge tube. Add 12 mL-methanol plus 2 mL-deionized water. Store for 24 hours.
2. After storage, vortex 5 min. and centrifuge samples.
3. Evaporate to 5 mL if extracted solids are also being evaporated, vortex, and centrifuge.
4. Prepare at least five 1-mL aliquots of solution from which to make the matrix standards. Spike in the appropriate amount of secondary pharmaceutical standards to make the working standards.
Note: Also prepare one 250 ng/mL matrix-free methanol standard in order to obtain the correct retention times. This is recommended because the matrix standards have more interferences and it's harder to be certain of the retention times without running a matrix-free methanol standard). This matrix-free methanol standard will not be used to construct the actual calibration curve.
5. Run the matrix-standards with the extracted solids samples to create a matrix-calibration curve which takes into account interferences that reduce the signal sensitivity of the HPLC/MS. The matrix-sample signals are typically 2-10x's less than matrix-free signals.
Note: Multiply the results by the dilution factor (if necessary) and then by the Extraction Efficiency multiplier (i.e. the inverse of the extraction efficiency). If appropriate, determine the half-life of the compound and adjust the final concentration depending on how long the sample was stored in methanol before extraction/analysis. The half-life values in the table below were calculated by measuring the concentration at t = 1 day and then 34 days later
Half-life equation: [Ct=34] = [Ct=1]*exp(-0.693*t/t0.5)
Table: Solids Extraction Efficiencies using Matrix Standards and Degradation at 4 days due to Halflife decay

Final Results
Fraction Recovery in the:
Fraction Recovery in the:
Liquid
Solids
Liquid+Solids
Solids
Liquid+Solids
Methods Conclusion:
1. Liquid analysis. The modified preparation and analysis procedures are acceptable.
2. Solids extraction. The efficiencies by EPA 1694 and modified method (matrix standards without TurboVap and SPE in order to reduce steps) are poor. Neither method is robust. Extraction efficiencies improved in the modified method (except Cotinine).
3. Mass balance. Pharmaceuticals not accounted for in the liquids were not completely accounted for in the solids. This may be due to poor extraction (i.e. inability to desorb compounds), physical/chemical reactions that degrade the parent compound over time (as seen in the half-life degradation study), or due to biological degradation by duckweed or attached microorganisms. The solid samples for this study remained in methanol for 46 days before analysis--allowing sufficient time for all but cotinine and acetaminophen to degrade by at least 50%.
Results/Discussion:
"A" Dark control reactor. Dark. No plant. Uncovered.
"B" Dark plant reactor. Dark. With plant. Uncovered.
"C" Light plant reactor. Light. With plant. Uncovered.
"D" Light control reactor. Light. No plant. Uncovered.
"E" Macerated plant reactor. Light. Macerated plant. Uncovered.
In the case of the control reactors, there were three types. First, controls in the dark without plants and covered with a lid. Second, controls in the dark without plants and uncovered. Third, controls in the light without plants and uncovered. There was no significant difference between the "A" dark and "D" light control reactors (p-value > 0.05 in all treatments as seen in these significance results testing for significance between treatments. Note: significance occurs when "p-adj" is less than 0.05). The uncovered plants were significantly less than the covered reactors, suggesting that some removal occurred due to exposure to the air (e.g. volatilization loss).
Loss due to sorption to glassware = LGS = (1 - reactor "X") x 100
Note: Sorption to glassware can be a significant loss during treatment and analysis. When evaporating samples after solid phase extraction rinsing and siliconization was an important step to prevent up to 70% of compounds from remaining on the glassware. This study (Baker 2011) researches this phenomenom.
In the case of acetaminophen, the results suggest that active uptake by the plant may play a major role in compound loss--which is expected due to its low pKow value (0.46)--see Dettenmeir 2008 (USU Thesis and Dissertations @ Digital Commons). The liquid removal charts show that whole plants removed significantly more compound than the macerated plants. One study showed that plants are able to metabolize acetaminophen by glucosidation (Huber 2009). The metabolites listed in the study were searched using Agilent's Qualitative MassHunter program. Some of the metabolites were identified in the liquid samples and increased (with respect to the area of the chromatograms) as the parent compound decreased. However, these studies require more careful analysis to ascertain whether the compounds identified were actually the metabolites.
In the case of progesterone, the liquid recovery results show that progesterone levels decrease immediately in the macerated samples and then whole plant sample reach the same removal levels within 24 hrs. This trend suggests that removal is achieved by sorption to duckweed cells and is supported by the fact that progesterone removal by duckweed fits a Freundlich isotherm at 26 degC well--this is expected due to its large pKow value. The rapid decrease in the macerated samples is attributed to more sorption sites due to the intracellular tissue in solution. Recovery from the liquid was poor most likely due to: inability to desorb progesterone from duckweed, matrix effects, or possibly metabolism by microrganisms attached to duckweed tissue.
In the case fluoxetine, the removal also fits a Freundlich isotherm (removal was repeated for three different concentrations) suggesting removal by sorption. However, unlike progesterone, fluoxetine recovery in the solids was better. Sorption is expected because this compound is positively charged with a large pKow.
In the case of carbamazepine, removal was not significant in any treatment. Typically, carbamazepine has poor removal from wastewater treatment plants. However, another reason for poor removal may be due to concomitant use with fluoxetine. Fluoxetine inhibits the reaction of carbamazepine (drugs.com):
In the case of sulfamethoxazole, it appears that sorption and desorption both occurred. This may be attributed to the multiple pka's of sulfamathoxazole. Poor sorption is expected when the compound is negatively charge. The fluctuating sorption/desorption could take place if there is an equilibrium process going on and the compound is going back and forth between neutral and negative charges. The compound should always be negative at pH 7.5-8.0 is the pKa is approximately 5.8; however, www.chemaxon.com predicts a pKa value near 7.7 which would explain the back and forth charge.
1. Liquid analysis. The modified preparation and analysis procedures are acceptable.
2. Solids extraction. The efficiencies by EPA 1694 and modified method (matrix standards without TurboVap and SPE in order to reduce steps) are poor. Neither method is robust. Extraction efficiencies improved in the modified method (except Cotinine).
3. Mass balance. Pharmaceuticals not accounted for in the liquids were not completely accounted for in the solids. This may be due to poor extraction (i.e. inability to desorb compounds), physical/chemical reactions that degrade the parent compound over time (as seen in the half-life degradation study), or due to biological degradation by duckweed or attached microorganisms. The solid samples for this study remained in methanol for 46 days before analysis--allowing sufficient time for all but cotinine and acetaminophen to degrade by at least 50%.
Results/Discussion:
Treatments
"X" Control reactor. Dark. No plant. Covered."A" Dark control reactor. Dark. No plant. Uncovered.
"B" Dark plant reactor. Dark. With plant. Uncovered.
"C" Light plant reactor. Light. With plant. Uncovered.
"D" Light control reactor. Light. No plant. Uncovered.
"E" Macerated plant reactor. Light. Macerated plant. Uncovered.
Chemicals
Acetaminophen = "ACT"
Sulfamethoxazole = "SLF"
Fluoxetine = "FLX"
Carbamazepine = "CRB"
Progesterone = "PRG"
Nicotine = "NIC"
Cotinine = "COT"
Sulfamethoxazole = "SLF"
Fluoxetine = "FLX"
Carbamazepine = "CRB"
Progesterone = "PRG"
Nicotine = "NIC"
Cotinine = "COT"
Physical/chemical removal
In the case of the control reactors, there were three types. First, controls in the dark without plants and covered with a lid. Second, controls in the dark without plants and uncovered. Third, controls in the light without plants and uncovered. There was no significant difference between the "A" dark and "D" light control reactors (p-value > 0.05 in all treatments as seen in these significance results testing for significance between treatments. Note: significance occurs when "p-adj" is less than 0.05). The uncovered plants were significantly less than the covered reactors, suggesting that some removal occurred due to exposure to the air (e.g. volatilization loss).
Loss due to sorption to glassware = LGS = (1 - reactor "X") x 100
Note: Sorption to glassware can be a significant loss during treatment and analysis. When evaporating samples after solid phase extraction rinsing and siliconization was an important step to prevent up to 70% of compounds from remaining on the glassware. This study (Baker 2011) researches this phenomenom.
In the case of acetaminophen, the results suggest that active uptake by the plant may play a major role in compound loss--which is expected due to its low pKow value (0.46)--see Dettenmeir 2008 (USU Thesis and Dissertations @ Digital Commons). The liquid removal charts show that whole plants removed significantly more compound than the macerated plants. One study showed that plants are able to metabolize acetaminophen by glucosidation (Huber 2009). The metabolites listed in the study were searched using Agilent's Qualitative MassHunter program. Some of the metabolites were identified in the liquid samples and increased (with respect to the area of the chromatograms) as the parent compound decreased. However, these studies require more careful analysis to ascertain whether the compounds identified were actually the metabolites.
Metabolites
Click here to view the analysis for metabolites, particularly the Acetaminophen metabolites acetaminophen-glucoside (molecular formula C14H19NO7, m/z = 314.1234) and acetaminophen-cysteine (molecular formula C11H14N2O4S, m/z = 271.0747). Other metabolites searched for included: Progesterone metabolite 5-alpha-pregnane3,20-diol (molecular formula C21H32O2, m/z = 317.2475); Fluoxetine metabolite Norfluoxetine (molecular formula C16H16F3NO, m/z = 296.1257); and Sulfamethoxazole metabolite N4-acetyl-sulfamethoxazole (molecular formula: C12H13N3O4S, m/z = 296.0700), and Carbamazepine metabolite Carbamazepine-10,11-epoxide (C15H12N2O2).
In the case fluoxetine, the removal also fits a Freundlich isotherm (removal was repeated for three different concentrations) suggesting removal by sorption. However, unlike progesterone, fluoxetine recovery in the solids was better. Sorption is expected because this compound is positively charged with a large pKow.
In the case of carbamazepine, removal was not significant in any treatment. Typically, carbamazepine has poor removal from wastewater treatment plants. However, another reason for poor removal may be due to concomitant use with fluoxetine. Fluoxetine inhibits the reaction of carbamazepine (drugs.com):
"Fluoxetine{116}{117}{119}{121} or Fluvoxamine{127}{128}
Concurrent use with carbamazepine may inhibit the metabolism of carbamazepine, resulting in increased plasma concentrations and toxicity; carbamazepine plasma concentrations should be monitored."
Concurrent use with carbamazepine may inhibit the metabolism of carbamazepine, resulting in increased plasma concentrations and toxicity; carbamazepine plasma concentrations should be monitored."
In the case of sulfamethoxazole, it appears that sorption and desorption both occurred. This may be attributed to the multiple pka's of sulfamathoxazole. Poor sorption is expected when the compound is negatively charge. The fluctuating sorption/desorption could take place if there is an equilibrium process going on and the compound is going back and forth between neutral and negative charges. The compound should always be negative at pH 7.5-8.0 is the pKa is approximately 5.8; however, www.chemaxon.com predicts a pKa value near 7.7 which would explain the back and forth charge.

